
The Economy & Strategies
Viewpoint 2025 First Half
Jan 2, 2025
By
Thomas Goho
Stephens will never ask clients or prospective clients for personal or financial information, or provide investment advice, via social media, or WhatsApp.
If you have any questions or concerns about someone from Stephens contacting you, please call your Stephens Representative or reach out to us via our Contact Us form.
We provide investment banking, research, sales and trading, asset and wealth management, public finance, insurance, private capital, and family office services.
We are a family-owned financial services firm that values client relationships, long-term stability, and supporting the communities where we live and work.
The idea of family defines our culture, because each of us knows that our reputation is on the line as if our own name was on the door.
Our reputation as a leading independent financial services firm is built on the stability of our longstanding and highly experienced senior executives.
We are committed to bettering the communities where we live and operate. We do this by supporting corporate philanthropy, economic and financial literacy advocacy, and professional success.
Stephens is proud to sponsor the PGA TOUR, LPGA Tour, and PGA TOUR Champions careers, as well as applaud the philanthropic endeavors, of our Brand Ambassadors.
Stephens is the official investment banking partner of Williams Racing, one of the most winning teams in F1 history. We share that tradition of success.
We host many highly informative meetings each year with clients, industry decision makers, and thought leaders across the U.S. and in Europe.
We provide fiduciary investment strategies to public-and private-sector institutional clients through asset allocation, consulting, and retirement services.
Decades of proven performance and experience in providing tailored fixed income trading and underwriting services to major municipal and corporate issuers.
Proven industry-leading research, global market insights, and client-focused execution.
Customized risk management, property & casualty, executive strategies and employee benefits solutions that protect our clients over the long term.
We assist companies with accessing capital through innovative advisory and execution services that help firms achieve their strategic goals.
We have been a trusted and reliable source of capital for private companies for over 70 years.
Our experienced Private Client Group professionals develop customized investment strategies to help clients achieve their financial goals.
We are a trusted municipal advisor with proven expertise in public financings. We also work with clients in negotiated and competitive municipal underwritings.
The Economy & Strategies
People who had been awaiting interest rate cuts from the Federal Reserve got their wish. Jerome Powell and his Fed team delivered three rate cuts in the second half of the year: one in September of .5% followed by second cut in November of .25% and a third cut in December of .25%.
The business media’s take on the announcements was that these interest rate cuts might prevent an economic slowdown from taking hold in the U.S.
We at Stephens don’t see recessionary conditions on the horizon nor any urgency for the Federal Reserve’s rate cuts. A more cautious policy would seem warranted considering the Republican election sweep, with likely large policy shifts. We believe the most immediate concern is stubbornly elevated inflation.
This issue of Viewpoint examines the state of the economy at the end of 2024 for signs of weakness that seemingly justified these significant Federal Reserve actions. In addition, we will analyze the future impact of these cuts on the following economic conditions:
U. S. Economic Growth
American economic growth has been solid over the past 12 months, averaging about 3% on a quarterly basis. (See Figure 1.)
Figure 1: Real Gross Domestic Product (Real GDP) for 2000 to Present, Percent Change from a Year Ago (Seasonally Adjusted).
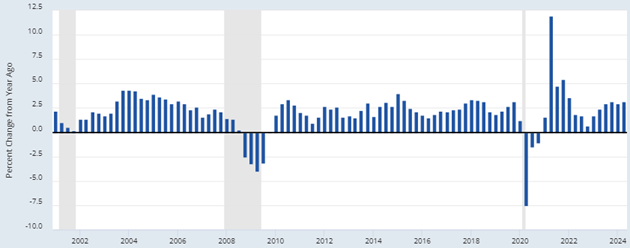
Shaded areas indicate recessions
Source: Federal Reserve Bank of St. Louis. Federal Reserve Economic Data (FRED), From U. S. Bureau of Economic Analysis.
Quarterly data for the past 8 quarters shows that the economy is performing well. (See Figure 2.) Growth is in line with a rate that the Congressional Budget Office (CBO) suggests is the potential growth for the U.S. economy. Real GDP growth of about 3% is a healthy rate. Higher growth often generates inflationary pressure such as that experienced in the immediate post-Covid period.
Figure 2: Quarterly Real GDP Growth for the Last 8 Quarters.
| Quarter Ending | Percent |
| September 30, 2024 | 2.80 |
| June 30, 2024 | 3.00 |
| March 31, 2024 | 1.40 |
| December 31, 2023 | 3.40 |
| September 30, 2023 | 4.90 |
| June 30, 2023 | 2.10 |
| March 31, 2023 | 2.20 |
| December 31, 2022 | 2.60 |
Average Growth 3.20%
Source: U. S. Bureau of Economic Analysis. Supplemental Information and Additional Data, October 2024.
The Federal Reserve Bank of Atlanta’s GDPNow forecasts that the economy remained strong in the fourth quarter of 2024 with GDP growing at a quarterly rate of 3.3%. (See Figure 3.) The Blue Chip Forecasters have a lower forecast at 2.1%. Neither forecast suggests that the economy is on the cusp of a recession.
Figure 3: Atlanta Federal Reserve GDPNow Real GDP Estimate for Fourth Quarter 2024, Seasonally Adjusted Annual Rate.
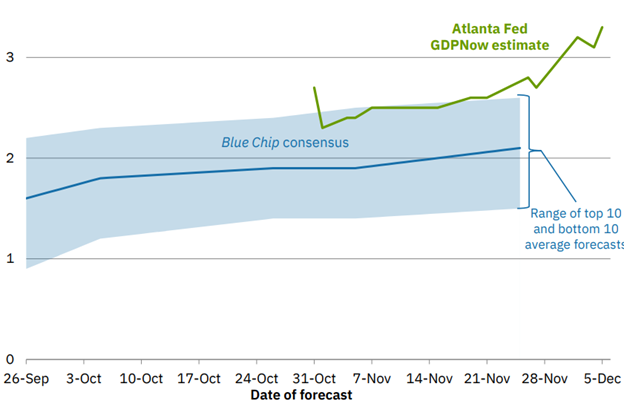
Sources: Federal Reserve Bank of Atlanta. GDPNow, December 5, 2024, and the Blue Chip Economic Indicators and Blue Chip Financial Forecasts.
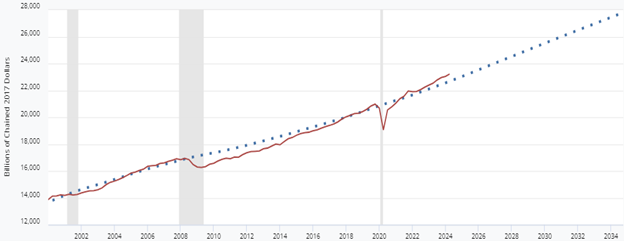
This short-run data suggests that the economy is growing at a solid rate. Growth of between 2% and 3% is consistent with the labor and capital base of the U.S. economy. In fact, the Congressional Budget Office (CBO) analysis suggests that the economy is growing somewhat above its long-term potential. (See Figure 4.)
Figure 4: Real Potential Gross Domestic Product (dotted line) and Real Gross Domestic Product (solid line), 2000 to Present.
Shaded areas indicate recessions
Source: Federal Reserve Bank of St. Louis. Federal Reserve Economic Data (FRED), From U. S. Bureau of Economic Analysis and the Congressional Budget Office.
Although actual growth above potential growth does not always presage inflationary pressures, it suggests that this higher growth might ultimately lead to more inflation.
Best Guess About U. S. Economic Growth.
The American economy is unlikely to experience a recession in the next 6 months. The current forecasts and other data do not suggest an impending recession. Continuing growth in the range of 2% to 3% is our best guess. The new Trump administration’s proposals to levy large tariffs create economic uncertainty that was not present two months ago. If higher tariffs are enacted, their impact would likely occur in late 2025, not the first half of the year.
American Labor Markets and Unemployment
Notwithstanding the Federal Reserve’s concerns about the state of American labor markets, the employment conditions remain healthy by historical standards. The unemployment rate is 4.2%, which is low in comparison to that rate over the past 50 years. (See Figure 5.) Unemployment was briefly lower in 2000 and 2019, but the fact remains that U.S. labor markets remain strong even if the unemployment rate has drifted higher in the past few months.
Figure 5: U.S. Unemployment Rate, Seasonally Adjusted, 1975 to Present.
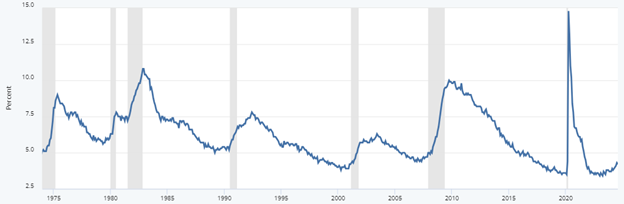
Shaded areas indicate recessions
Source: Federal Reserve Bank of St. Louis. Federal Reserve Economic Data (FRED), From U. S. Bureau of Labor Statistics data.
Increases in first-time jobless claims can be a warning sign of impending weakness in labor market conditions. Again, these claims remain well within a normal level which is indicative of normal labor market frictions. (See Figure 6.) People are hired and terminated regularly in U.S. labor markets.
Figure 6: Initial Jobless Claims (seasonally adjusted) from 2000 to Present.
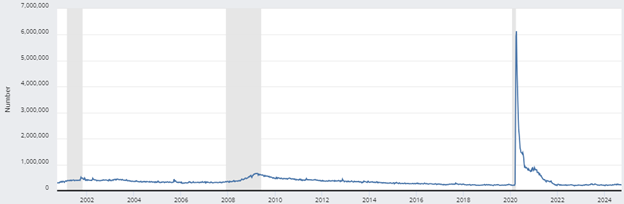
Shaded areas indicate recessions
Source: Federal Reserve Bank of St. Louis. Federal Reserve Economic Data (FRED), From the U. S. Employment and Training Administration data.
In the past 25 years the number of first-time jobless claims have averaged between 200,000 and 300,000 workers per week, except during periods of recession. At the present time, these claims are running approximately 210,000 per week: not a sign of recession.
A third measure of labor market conditions is the labor force participation rate. The core labor market is composed of individuals 25 to 54 years of age. A strong labor market is often characterized by a high participation rate within that age group, and that is clearly the case in late 2024. (See Figure 7.)
Figure 7: Labor Force Participation Rate for Individuals 25 to 54 Years of Age, 2000 to Present
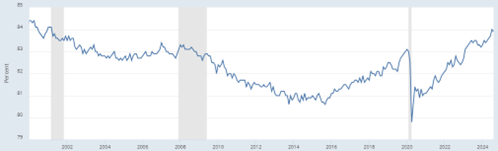
Shaded areas indicate recessions
Source: Federal Reserve Bank of St. Louis. Federal Reserve Economic Data (FRED), From U. S. Bureau of Labor Statistics data.
This improvement in labor participation rates is seen across most demographics. There has been an improvement in post-Covid participation rates for prime working-age individuals, for both men and women 25-54 years of age. (See Figure 8.)
Figure 8: Labor Participation Rates for Male (solid line) and Female (dash line), age 25-54.
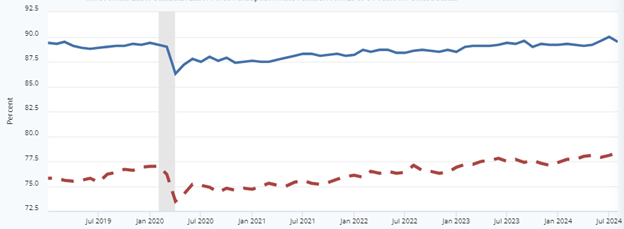
Shaded area indicates recession.
Source: Federal Reserve Bank of St. Louis. Federal Reserve Economic Data (FRED), from the Organization for Economic Co-operation and Development.
A fourth manifestation of the solid labor market is the growth in the total workforce. The increase in the size of the total labor force is in line with the growth seen prior to the pandemic. Between 2012 and 2019 the U.S. labor force was growing at a rate of slightly more than 2 million workers per year. In late 2024, the labor force increased at a rate of between 2 and 2.5 million workers. (See Figure 9.)
Figure 9: Growth in the Total Non-Farm Workforce from 2010 to Present, Seasonally Adjusted.
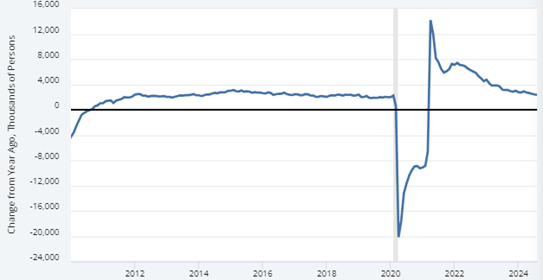
Shaded area indicates recession
Source: Federal Reserve Bank of St. Louis. Federal Reserve Economic Data (FRED), From U. S. Bureau of Labor Statistics data.
The job gains noted in the figure show that the increases are slowing, but this slowing is to be expected given the economic paroxysms that transpired during and after the pandemic. Current job growth is in line with long-term trends.
Best Guess About U.S. Labor Markets and Unemployment
Labor market conditions are strong as measured by the unemployment rate, initial jobless claims, and the labor participation rate, among other employment measures. We at Stephens do not see the pre-conditions in labor markets for a near-term recession. We expect positive labor market conditions will continue through the first half of 2025 and probably throughout the whole year. We expect the unemployment rate to increase to no more than 4.5%, a healthy rate by historic standards.
Inflation and Prices
When Chairman Powell and the Federal Open Market Committee (FOMC) of the Federal Reserve in September cut its target interest rate by .5%, Fed officials signaled that inflation was clearly moving closer to its 2% inflation target. (See Figure 10.)
Figure 10: Federal Reserve Officials Economic Projections for Core Inflation (Core PCE), 2024, 2025, 2026, and 2027.
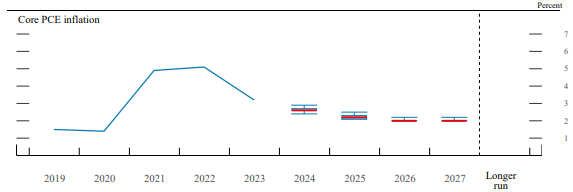
Source: Federal Reserve Board, Summary of Economic Projections, September 18, 2024. Page 2.
Fed officials expect 2024 core inflation to be 2.4%, slightly above its goal of 2% and dropping to 2.2% in 2025 and 2026. The 2% target will be reached in 2027. With those expectations for future inflation, it is not surprising that the Fed acted to cut short-term interest rates.
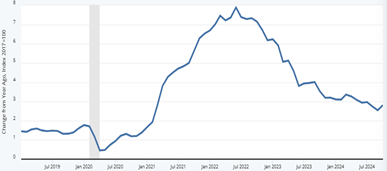
We at Stephens see a somewhat different inflation picture. Core inflation (Core Personal Consumption Expenditure Price Index) remains elevated and higher than the Fed’s 2024 projection (See Figure 11.) The year-over-year increase in October was running 2.8%.
Figure 11: Personal Consumption Expenditures Price Index, 2009 to Present, Seasonally Adjusted.
Shaded area indicates a recession.
Source: Federal Reserve Bank of St. Louis. Federal Reserve Economic Data (FRED), From U. S. Bureau of Economic Analysis.
The Federal Reserve of Dallas adjusts the core price index. It starts with the broad measure of inflation contained in the Personal Consumption Expenditure Index and then removes the extremely positive and negative outliers to derive a true core inflation. (See Figure 12.) The most recent report indicates that core inflation is running about 2.7%, very much in line with the broader measure of PCE inflation.
Figure 12: Trimmed Mean Personal Consumption Expenditures Inflation Rate, 2009 to Present.
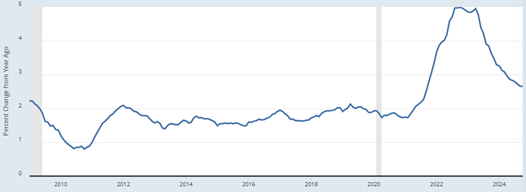
Shaded area indicates a recession.
Source: Federal Reserve Bank of St. Louis. Federal Reserve Economic Data (FRED), from the Federal Reserve Bank of Dallas.
Both measures indicate elevated inflation. Ignoring the inflation bubble related to Covid from 2020 to 2023, the current inflation is significantly higher than the period of 2009 to 2019, a period when inflation was running at a rate within the Fed’s comfort level of 2%.
Best Guess About Inflation and Prices
We at Stephens think that, in general, the Federal Reserve has the correct view of inflation. Where we differ from the Fed is the timeframe. We think that inflation is moving toward its 2% goal but at a slower pace than the Fed expects, based on the minutes of its recent meeting.
Given the Fed’s almost disastrous statement in 2021 that inflation was transitory, we think extreme caution is warranted when cutting rates. In our opinion, postponing any rate cut until at least 2025 would have been prudent. We expect the 2025 inflation rate to remain about 2.5%. However, too many Fed rate cuts could easily slow down the descent rate to achieve its 2% goal.
If the Trump administration and Congress do implement sweeping tariff increases, all bets are off the table. American tariffs (and any retaliatory tariffs) will rekindle inflation.
In brief, the U.S. economy is hitting on all cylinders: solid growth, near full employment, moderating prices. These trends are likely to continue through much of 2025. These observations, however, are dependent on existing economic policies, not the incipient policies of the new administration.
A Longer-Term View of the American Economy
The current solid economic performance was made possible, in large part, by misguided policies which are legislatively mandated to continue for the foreseeable future. By all reasonable standards, U.S. government fiscal policy is out of control and thus producing massive budget deficits. Yet, these policies are a strong short-run stimulus which increases growth and inflationary pressures.
Between 1974 and 2023, average U.S. government spending was 21% of GDP and revenues were 17.3%, representing a budget deficit of 3.7%. (See Figure 13.) Many economists think that a deficit of that size is sustainable for a developed economy. The economic thinking is that a 2% to 3% economic growth can support a 3% annual budget deficit.
If the conservative estimates of the Congressional Budget Office (CBO) are correct, the U.S. deficit will average 5.9% between 2025 and 2029 and higher between 2030 and 2034 at 6.3% of GDP. In other words, the U.S. deficit is and will be about twice the sustainable rate over the next 10 years, and certainly beyond 2034.
Figure 13: Federal Government Total Outlays and Revenues, 1974 to 2034 (Estimated).
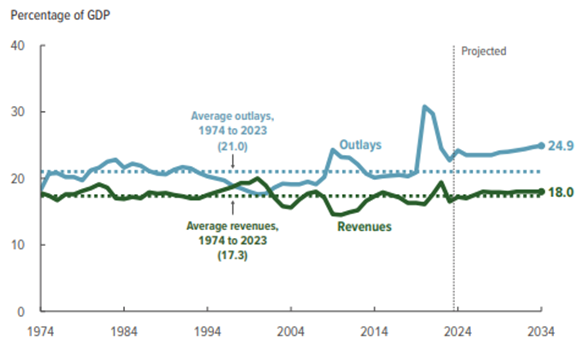
Source: Congressional Budget Office. “An Update to the Budget and Economic Outlook: 2024 to 2034. Page 2.
These estimates are built on optimistic assumptions of 2% GDP growth, full employment of about 4% and inflation of about 2% for the entire 10-year period. In other words, the estimates exclude any recessions, no significant wars, no technological disruptions or virus issues, among many other downside factors. These estimates do not include any future expansion in government programs, nor do these estimates include policy changes proposed by the Incoming Trump administration.
It is reasonable to assume that the CBO’s projection is the best-case scenario for the next 10 years. The non-partisan CBO continues to play catch-up with actual government spending. For example, in February 2024, the CBO estimated that the 2024 budget deficit would be $1.5 trillion. In June 2024, that deficit was revised upward to $1.8 trillion. The upward revision of a “modest” $300 billion occurred in an economy operating at or near full employment. Many economists would expect that such an economy would generate minimal deficits, not one with a current deficit of over 5% of GDP.
Figure 14: Federal Deficits as a Percent of Gross Domestic Product, 2001 to Present.
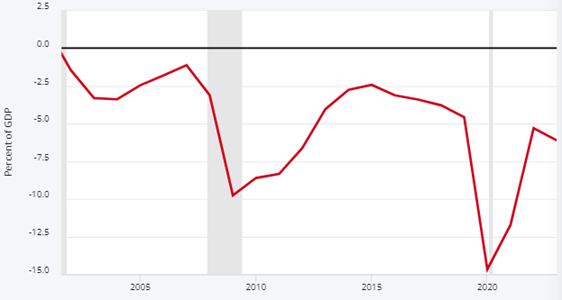
Shaded areas indicate recessions
Source: Federal Reserve Bank of St. Louis. Federal Reserve Economic Data (FRED), From the U. S. Office of Management and Budget.
The Committee for a Responsible Federal Budget (CRFB) estimates that if all Trump’s proposals are enacted, the Federal deficit will increase by about $7.5 trillion over 10 years which represents an additional Federal deficit of about 3% of GDP per year above the CBO’s estimates: about $2.5 trillion per year. The current projections for 2030 place the U.S. ratio of Federal debt to real GDP at 124%, while the Trump plans would increase that ratio to 142%.
The “old-time” theory of government finances posits that during periods of full employment the government should run a budget surplus. This surplus would fund the deficits during a recession. The U.S. government last generated a budget surplus a quarter of a century ago during the Clinton presidency.
Those individuals who argue that the problem is a shortfall in tax revenues seem to forget that Federal revenues as a percent of American GDP have remained stable for 50 years and are currently above that long-term average. Spending, on the other hand, has exploded relative to the size of America’s GDP. And this explosion is projected to continue for the foreseeable future.
In recent decades the Federal Reserve, using its monetary policy, was willing and able to absorb a significant amount of the Federal debt by a large expansion in its balance sheet. (See Figure 15.) It bought U.S. Treasury bonds, notes and bills. These purchases swelled the size of the Federal Reserve balance from about $700 billion in 2007 to almost $9 trillion in 2022.
Figure 15: Total Assets of the Federal Reserve Banks, 2003 to Present.
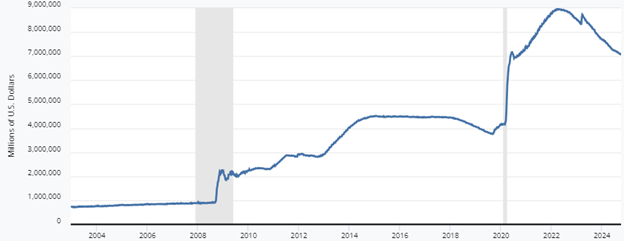
Shaded areas indicate recessions
Source: Federal Reserve Bank of St. Louis. Federal Reserve Economic Data (FRED), From the Board of Governors of the Federal Reserve System.
In the buying process, the Fed generated unusually low interest rates on the Federal debt. These low interest rates enabled the government to spend with only a minimal impact on the Federal budget: low interest expense on the Federal budget. In July 2022, the government issued 10-year debt with an interest rate of slightly more than .5%. (See Figure 16.)
Figure 16: Interest Rate on the 10-Year U.S. Treasury Notes, 2004 to Present.
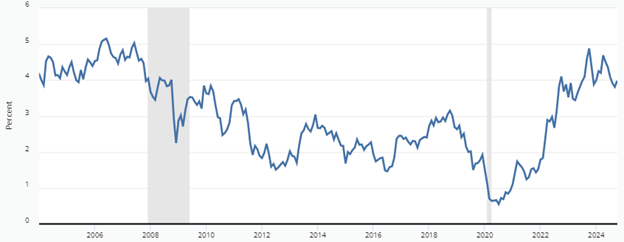
Shaded areas indicate recessions
Source: Federal Reserve Bank of St. Louis. Federal Reserve Economic Data (FRED), From the Board of Governors of the Federal Reserve System.
At least 3 questions are raised by these last two figures:
We at Stephens think that the Federal government is entering a very difficult period. Current high interest rates will generate high interest expense which will exacerbate the size of the Federal deficit thus creating high U.S. Treasury borrowing. Without large Fed purchases of Treasury debt, interest rates will finally return to their historically normal levels of at least 4% to 5%.
Households and businesses will face higher mortgage, auto, and credit card costs, among others. We expect these elevated rates will continue for the foreseeable future. Three percent mortgages and zero interest rates on auto loans are gone. This situation is not the new normal but the old normal that prevailed in much of the 20th century.
Household asset allocation decisions in 2025 and beyond will be complex and will require investors and their advisors to identify an appropriate asset mix which reflects this new higher interest environment.
Final Thoughts
Based on the current data, the next 6 to 12 months should be positive for the economy.
Elections season is done and Republicans won in a sweeping victory. Fiscal responsibility was excluded from both parties’ platforms. A second Trump administration ushers in a whole new set of economic and fiscal uncertainties. His proposed corporate and individual tax cuts could boost the American economy which is already operating at or near full employment. However, his proposed tariffs, if passed, will be inflationary. Strong growth and higher inflation create a volatile mix which complicates decision-making for households and businesses. A loser in all the government machinations is sure to be the American taxpayer.
One certain bet is that the U.S. government will not run a Clintonesque budget surplus again in your lifetime, nor in the lifetime of your children or grandchildren.
If Benjamin Franklin were alive in 2025, he might have said “Nothing is certain in life except death, taxes … and Federal deficits.”

Thomas Goho, Ph.D. is formerly the Chief Economic Consultant for Stephens Inc. He also served as the Co-Director of Stephens University at Wake Forest University.