The United States has faced unprecedented economic uncertainty since early 2020. The economy experienced about a one-third contraction in 2020 followed by a one-third expansion. Since then, the economy has stabilized but some volatility remains. The Federal government committed about $5 trillion in spending to counteract Covid’s negative economic effects on households, governments, and businesses—small and large. Unfortunately, economic uncertainty continues to affect not only our nation but also economies worldwide.
Heading into 2023, continued economic uncertainty leads to important questions for American governments, businesses, and households. Questions such as:
- What are the growth prospects for the American economy in 2023 and beyond?
- Will inflation moderate or should we expect still higher rates?
- Will labor markets soften in 2023, and what impact will Federal Reserve’s rising interest rates have on employment conditions?
- What is the economic condition of the Federal budget after recent large spending initiatives?
Accurate assessments of the American economy for the last couple of years have remained difficult for key forecasters and politicians as they grapple with unique economic circumstances. We will, however, offer you our economic observations, assessments, and conclusions.
Economic Growth
American economic performance as measured by real gross domestic product (real GDP) has been tepid in 2022. Real GDP contracted in the first two quarters of 2022 and then rebounded by 2.9% in the third quarter (See Figure 1.)
Figure 1: Real Gross Domestic Product, Quarterly Change. 2020 to Present.
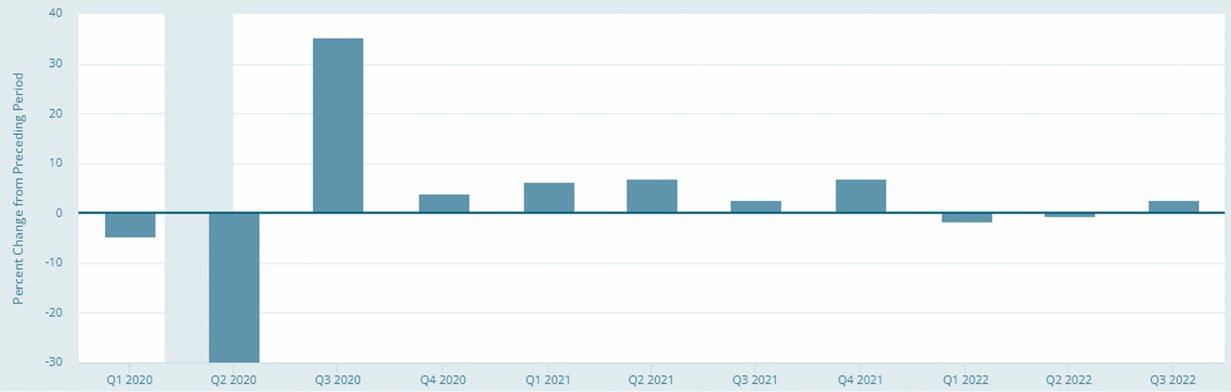
Note: Shade area indicates recession.
Source: Federal Reserve of St. Louis. Federal Reserve Economic Database (FRED), extracted from the database on December 8, 2022.
The National Bureau of Economic Research (NBER), the arbiter of recessions, has not yet determined if the first two quarters of contracting growth meet the normal standard for a recession. This indecision is likely due in part to the NBER’s consideration of a wide range of factors, not just changes in real GDP. It needs more information to make its decision concerning a recession.
Even if the NBER decides that no recession occurred in early 2022, the forecasts of future domestic growth are unimpressive.
The Federal Reserve’s own forecasts for economic growth suggest that current and future economic expansion will be anemic. It sees growth of .2% in 2022 followed by 1.0% in 2023 and 1.7% in 2024. (See Figure 2.) These growth rates, if they materialize, are sub-par even compared to weak growth rates in previous years of the 21st century. Most economists think that a vibrant economy needs to grow by 2%, but preferably 3%, to support an increasing standard of living and larger population.
Figure 2: Federal Open Market Committee (FOMC) Forecast for the Annual Growth Rate of Real GDP.
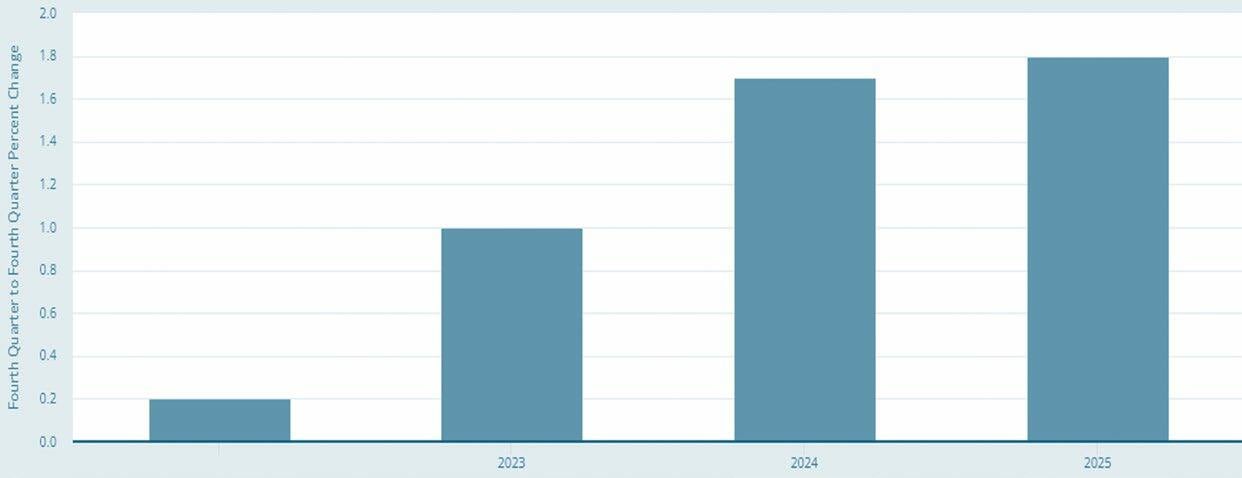
Source: Federal Reserve of St. Louis. Federal Reserve Economic Database (FRED), extracted from the database on December 9, 2022.
The Federal Reserve decision-making group is not the only group that anticipates weak growth. (See Figure 3.) Most economic forecasters, notwithstanding two negative growth quarters in early 2022, are continuing to forecast weak growth but higher than the Fed’s 2022 estimates. For 2023, forecasters are anticipating tepid growth of 0.3%, significantly lower than the Fed’s forecast of 1.0% growth.
Figure 3: Forecasts of Real GDP for 2022 and 2023 by a Sample of Institutions and Organizations.
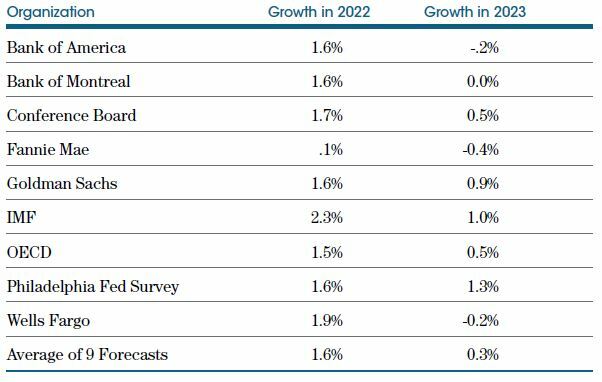
Sources: Various forecasting organizations.
The rosiest of the economic scenarios was proffered by the White House in its 2023 budget plan. It forecasts real GDP of 3.2% in 2022 and 2.0% in 2023. It is simple to minimize expected budget deficits when forecasts are divorced from economic reality. Certainly, the Biden administration is not the first administration to commit such financial legerdemain—nor likely the last.
Best Guess About Economic Growth
Our best guess is the economic growth rate between the Fed estimates for 2022 and 2023 and those of the economic forecasters noted above. We think there will be minimal growth for 2022 because economic conditions are deteriorating quickly as the Fed raises interest rates. Therefore, the annualized growth for 2022 will be about 1% after the 4th quarter GDP is reported in late January.
Economic growth in 2023 will be even more muted than in 2022. Since Federal Reserve’s large interest rate hikes of 2022 will require at least 12 months to 18 months to ripple through the economy, those impacts will be felt most acutely in mid-2023 and beyond with growth of about zero. We think the average growth rate of the nine forecasts above is right, and that the Federal Reserve is too optimistic in predicting 2023 growth of 1.2%.
Will 2022-23 qualify as a recessionary period? Probably, if one reads between the lines. It’s likely the Federal Reserve is hoping for a mild recession. The Fed seeks a dramatic slowdown in areas such as housing and hiring to cool the inflationary pressures, which the Fed facilitated. Its actions will cause a mild recession, meaning a small and short-lived contraction in U.S. output.
Inflation
Key economic forecasters and politicians were wrong for an extended period about the intensity and persistence of inflation.
Note the statements and decisions of key policymakers:
- Janet Yellen, Secretary of the U. S. Treasury and former chair of the Federal Reserve, stated in March 2021 that inflation posed only a “small risk” for the U.S. economy.
- The Federal Reserve maintained an expansionary monetary policy in 2021 and early 2022, and it professed confidence that inflation was “transitory” as recently as April 2022. Yet, inflation was running far above its target rate of 2%.
- President Biden averred “No inflation” in August 2022
- Congress in August 2022 passed the Inflation Reduction Act (IRA), which many reputable forecasting organizations determined would have no discernible impact on inflation reduction.
- Federal Reserve decision makers in September 2022 forecast that inflation would drop to about 3% in 2023 and a little more than 2% in 2024.
Despite policymakers’ proclamations, American consumers have experienced quite a different reality. Just how bad is American inflation? If one judges by examining the headline numbers, the Consumer Price Index (CPI), inflation is dreadful. (See Figure 4.) In recent months, overall prices have increased at a rate of over 7%. These overall prices include food and energy, which some economists point out are highly volatile and should be excluded from price indices.
Figure 4: Consumer Price Index for All Urban Consumers, 2015 to Present.
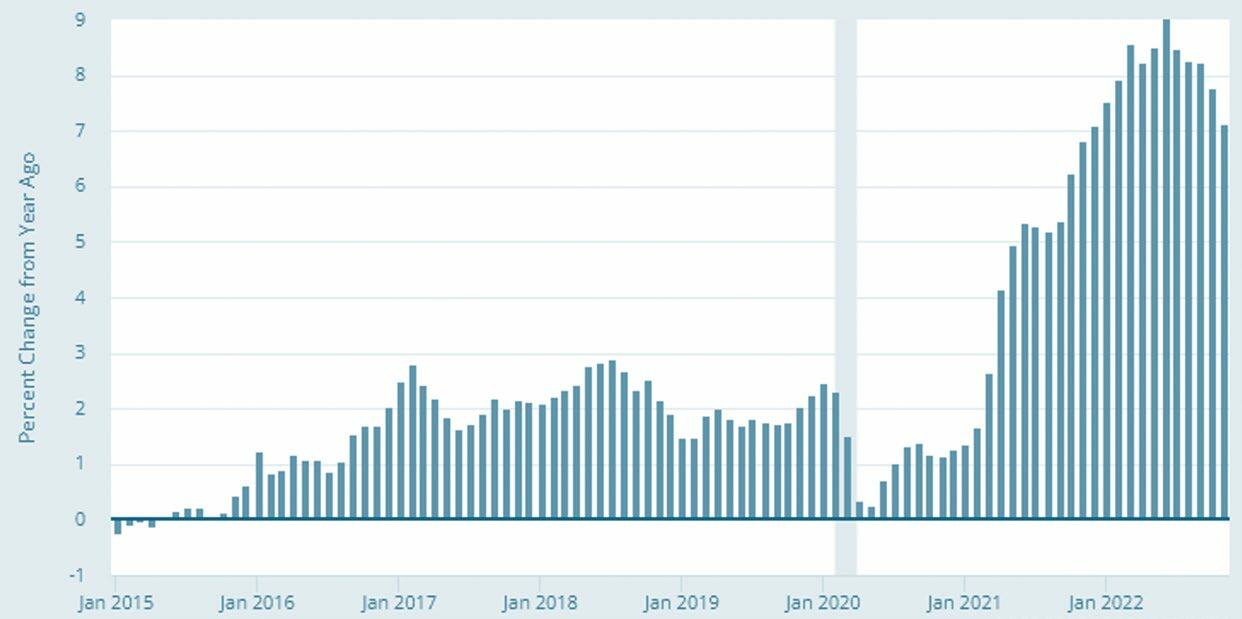
Note: Shade area indicates recession.
Source: Federal Reserve of St. Louis. Federal Reserve Economic Database (FRED), extracted from the database on December 9, 2022. (From the Bureau of Labor Statistics).
Two observations about food prices are relevant. (See Figure 5.) First, food prices have been increasing recently at an annualized rate of more than 10%. This is the highest rate of increase in more than 40 years. Most households expect modest food price increases, not double-digit rises. Increases of 2% to 4% are much more manageable for lower-income households than the increases they are now experiencing. The lowest income households spend 27% of their income on food compared to 7% for the highest income households.
Figure 5: Consumer Price Index for Food for All Urban Consumers, 2015 to Present, (Year-over-Year Change).
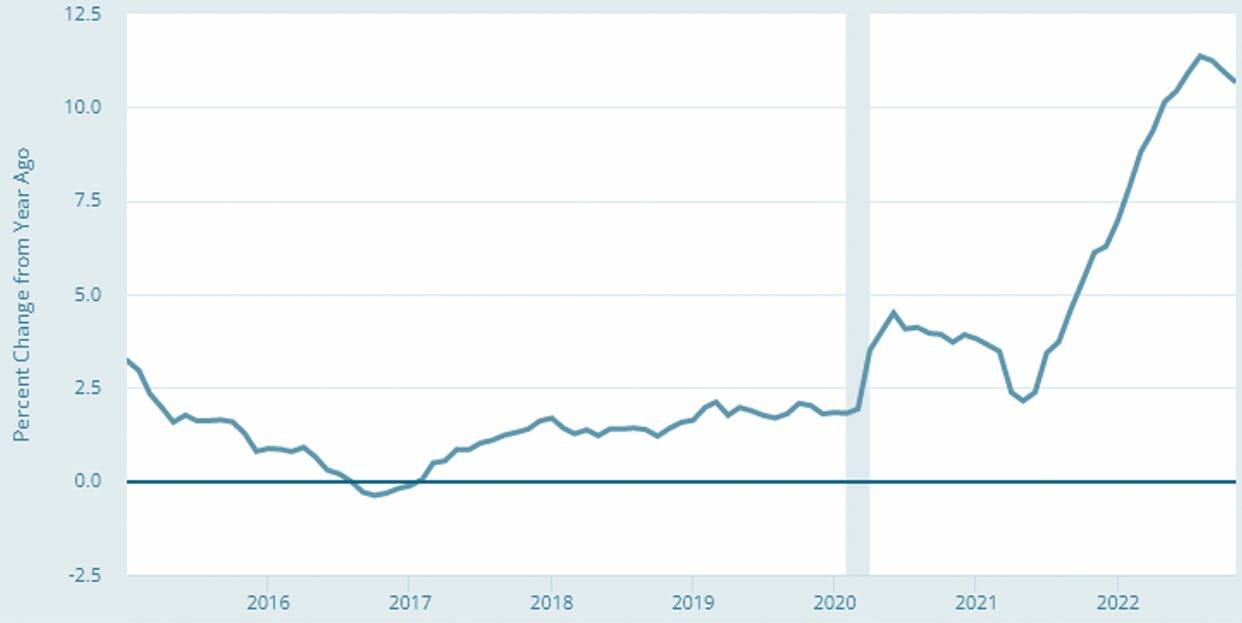
Note: Shade area indicates recession.
Source: Federal Reserve of St. Louis. Federal Reserve Economic Database (FRED), extracted from the database on December 9, 2022. (From the Bureau of Labor Statistics data).
Federal Reserve officials, some politicians, and market economists employ a different measure of inflation than the CPI. The Personal Consumption Expenditures Index (PCE), a more dynamic model of prices, suggests that price increases are less intense than the headline index (CPI). (See Figure 6.) In recent months the PCE index excluding food and energy has increased at a rate of about 5%. This increase is more than twice the target rate of 2% that the Federal Reserve has sought for decades, hardly a comfort to monetary decision makers.
Figure 6: Personal Consumption Expenditure (PCE) Inflation, 2012 to Present.
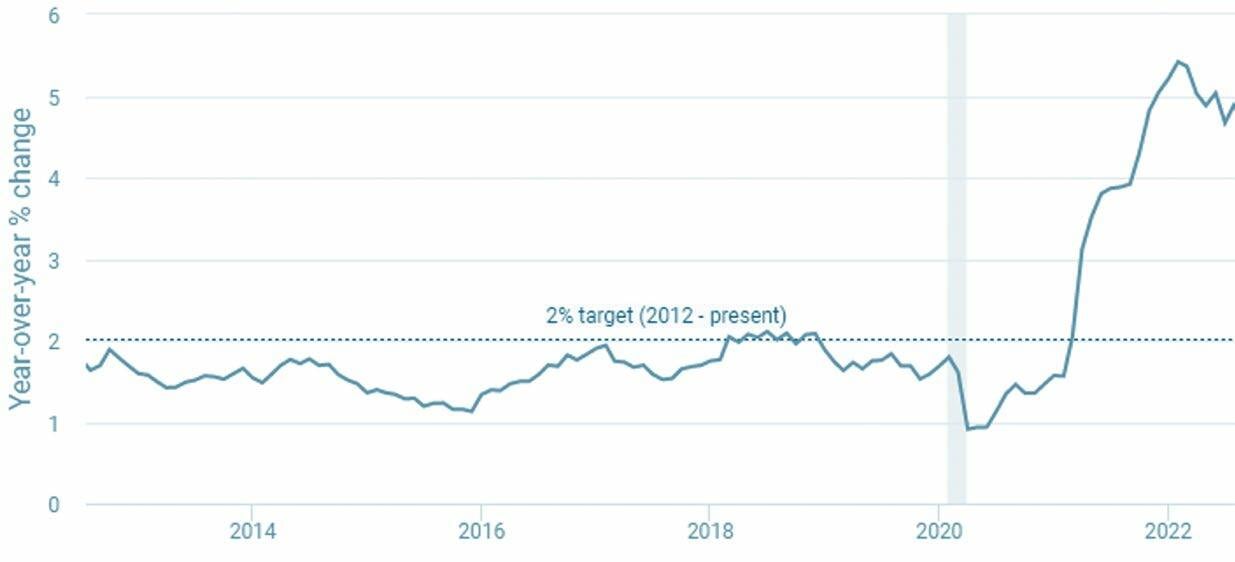
Note: Shade area indicates recession.
Source: Federal Reserve of St. Louis. Macro Snapshot December 2022 (From the Bureau of Economic Analysis data).
Best Guess About Inflation
Jerome Powell and the Federal Reserve decision makers are employing aggressive interest rate increases to stifle the surge of inflation. But inflation rarely ends quickly and without significant pain for American households. Mr. Powell has indicated that he is willing to impose all the pain needed to curtail the inflationary spiral that he and the Fed largely facilitated.
Federal Reserve officials (FOMC) are now forecasting that inflation will return to about 2% by 2025. (See Figure 7.) The trajectory according to FOMC forecasts suggests PCE core inflation in 2022 of 5.5%, followed by 3.05%, 2.35% and 2.1% in the three years after 2022.
Figure 7: Federal Open Market Committee (FOMC) Projections for PCE Inflation. 2022 to 2025.
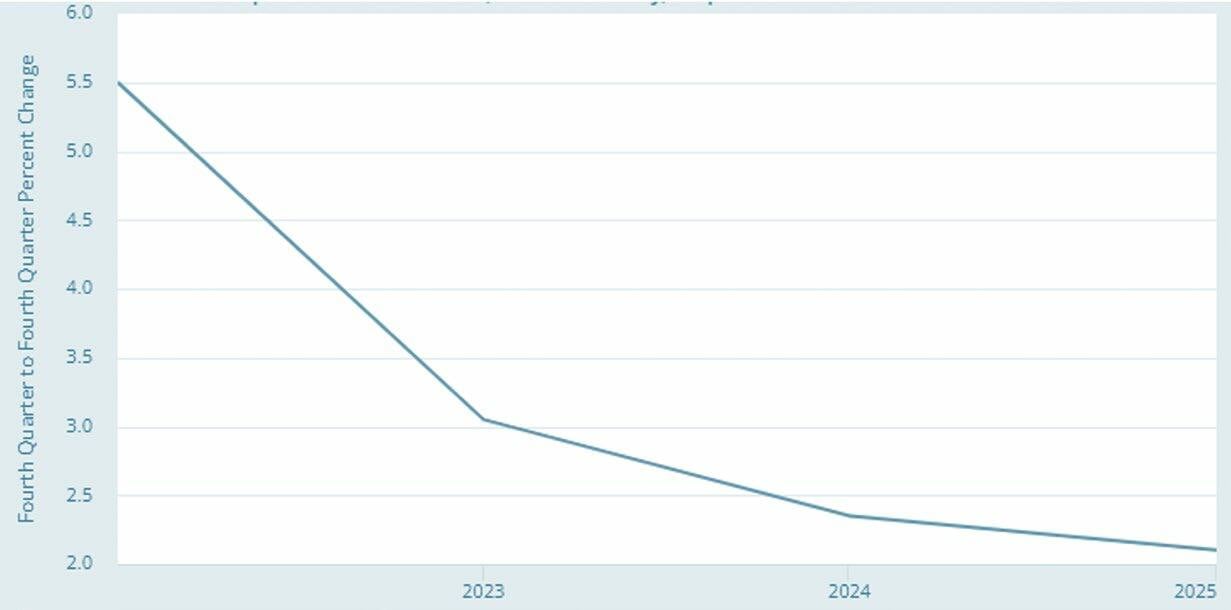
Source: Federal Reserve of St. Louis. Federal Reserve Economic Database (FRED), extracted from the database on December 9, 2022. (From FOMC minutes.)
The Federal Reserve, by its own admission, has a mediocre track record in forecasting changes in the fundamental conditions of the U.S. economy. The Fed’s inflation rate forecast, in our opinion, is too optimistic. Even if a recession occurs, inflationary pressures are often intractable and will persist at a high rate throughout most of 2023.
Current inflation is driven not only by price increases in goods like food and energy. Inflation is now pervasive in the service sector: for example, doctors’ fees, insurance premiums, household services. These prices are sticky and persistent, unlike food and energy that are inextricably linked to commodity prices.
Inflation has begun to decrease in recent months, probably because of recent Fed actions. Still, we at Stephens expect headline inflation to exceed 4% for 2023 and 3% for 2024, about 1% higher per year than a recent Fed’s forecast.
Labor Markets
Labor markets are healthy, at least on the surface. The unemployment rate remains near a multi-decade low (3.7%). In normal times, such a low rate would be remarkably good for the economy.
Figure 8: Unemployment Rate, 2000 to Present.
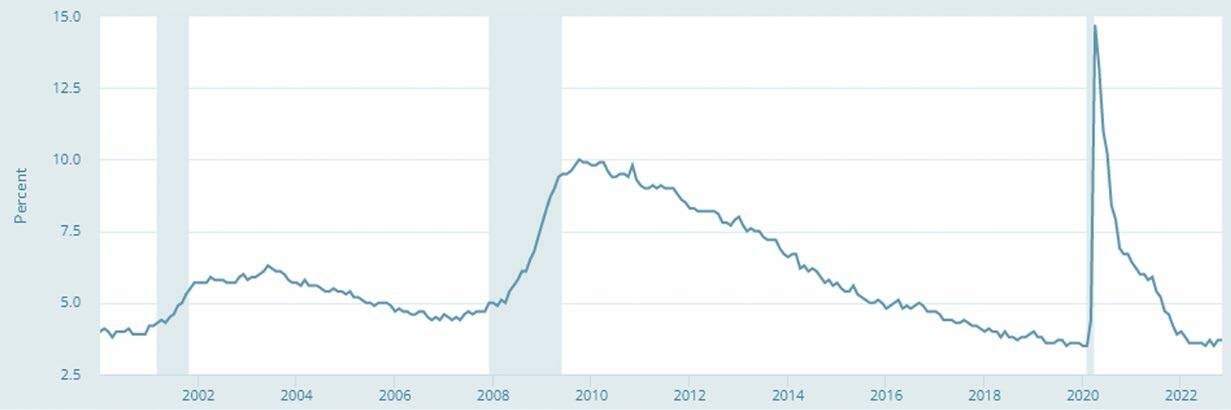
Note: Shade areas indicate recessions.
Source: Federal Reserve of St. Louis. Federal Reserve Economic Database (FRED), extracted from the database on December 9, 2022. (From U.S. Bureau of Labor Statistics).
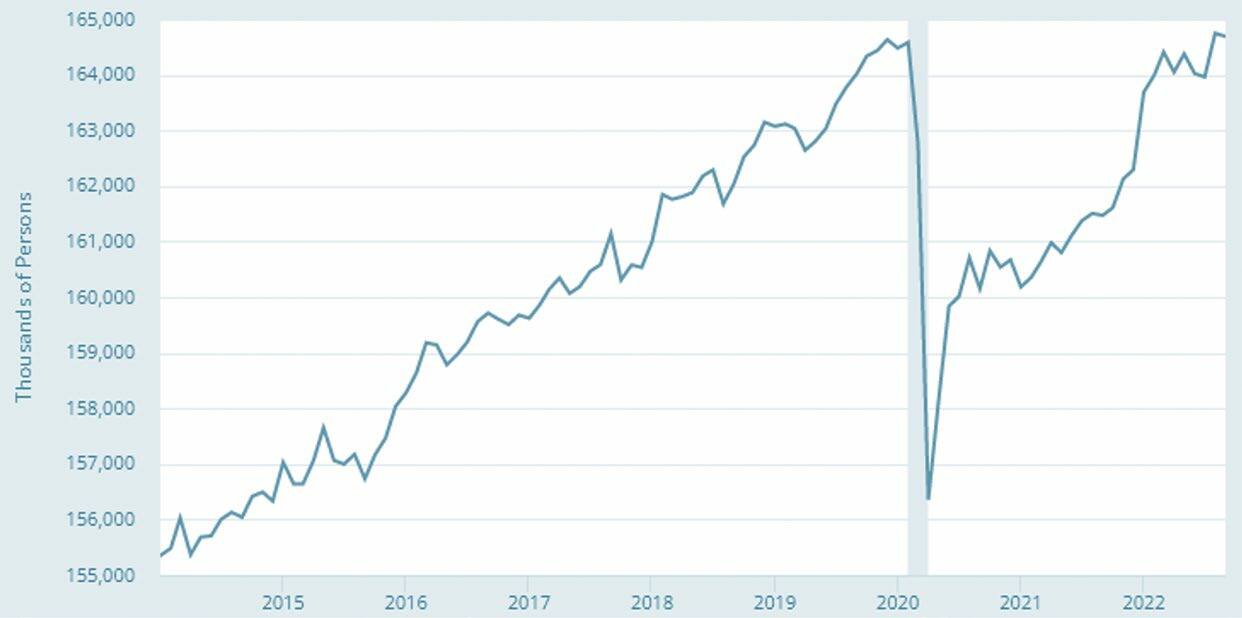
But the post-Covid world is abnormal. Workers have disappeared from the labor force in very large numbers leaving employers scrambling for workers. At the end of 2022 about 164 million workers were in the labor force, approximately the same number as there were the month before Covid started (See Figure 9.) An observer might think that it is not so bad given the intensity of the economic dislocations during and after the Covid epidemic.
Figure 9: U.S. Civilian Labor Force Level: 2014 to Present.
Note: Shade area indicates recession.
Source: Federal Reserve of St. Louis. Federal Reserve Economic Database (FRED), extracted from the database on December 9, 2022. (From U.S. Bureau of Labor Statistics).
In fact, given that the U.S. population is growing at about 1% per year, this almost stagnant work force level is detrimental to economic expansion.
- From January 2020 to late 2022, almost 3 years, the U.S. labor force grew by about 1 million workers.
- For comparison, 2017 to 2019, the work force growth was 5 million.
- In the 3-year period from 2014 to 2016, the work force grew by 4 million workers.
A recent index of total number of hours Americans are working is about the same when compared to the months prior to the start of Covid. However, we currently have a low unemployment rate with the strong monthly addition of 250,000 or more new employees. The bottom line is that the total number of hours Americans are working is falling, or static at best.
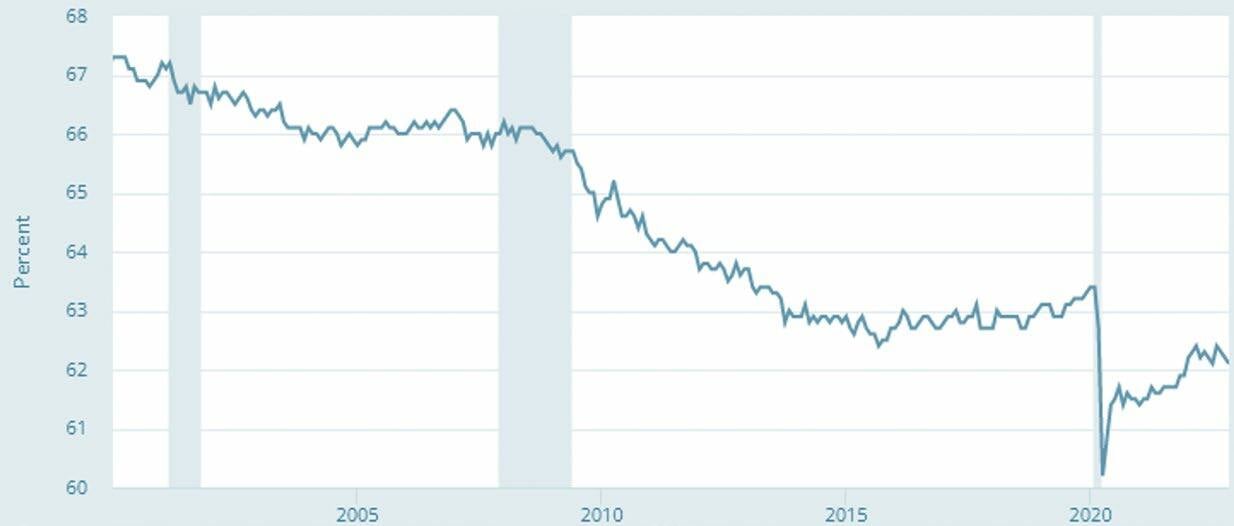
What’s going on in the American labor markets? First, the population is growing slowly at less than 1% per year. Second, the labor participation rate is falling. Prior to the pandemic in January 2020, the labor participation of workers was about 63.4%. Now the participation rate is 62.3%. (See Figure 10.) The decrease is small, but it is the continuation of a decades long trend. In January 2000, the participation rate was 67.2%. It seems fewer American workers are choosing to work.
Figure 10: Labor Participation Rate of the American Work Force, 2000 to Present.
Note: Shade areas indicate recessions.
Source: Federal Reserve of St. Louis. Federal Reserve Economic Database (FRED), extracted from the database on December 15, 2022. (From U.S. Bureau of Labor Statistics).
How does labor participation vary across demographic dimensions when comparing pre- and post-COVID rates? (See Figure 11.) The media myth is that women are the main driver of decreased labor participation because they lack childcare resources. As the data indicate, it is men, more than women, that account for the decline in labor participation.
Figure 11: Pre- and Post-COVID Labor Participation Rate by Demographic Factors.
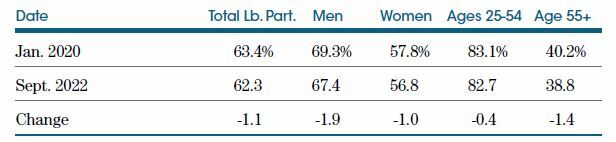
Source: U.S. Bureau of Labor Statistics. Data from September 2022 Reports.
The data seems to suggest that the Covid pandemic has simply accelerated a trend that has been occurring for at least 20 years: falling labor participation rates across most demographic groups. More men, women, and prime workers (age 25 to 54) are disengaging from the labor markets.
The one anomaly in the long-term data relates to workers 55 and above. In 2000, their labor participation was 32.3%. It is now 38.8%, a significant increase in work rates where all other groups are working less. As the US population ages and the labor participation rate of senior citizens increases, it provides an important counterweight to:
- Very slow growth in the U.S. population
- Slow growth in the workforce, and
- The deteriorating labor participation of all demographic groups except those over 55.
Best Guess About Labor Markets
If the U.S. economy heads into a recession, the labor markets are positioned to avoid the draconic impacts of a normal downturn. Jobs are plentiful, but many workers are cautious or uninterested in reentering the work force. Unemployment is likely headed up from the current rate of 3.7%. We expect that given the relatively robust availability of jobs; the unemployment rate should peak at no more than 5%. Historically, that rate was considered not far from full employment.
U.S. Fiscal and Monetary Policies
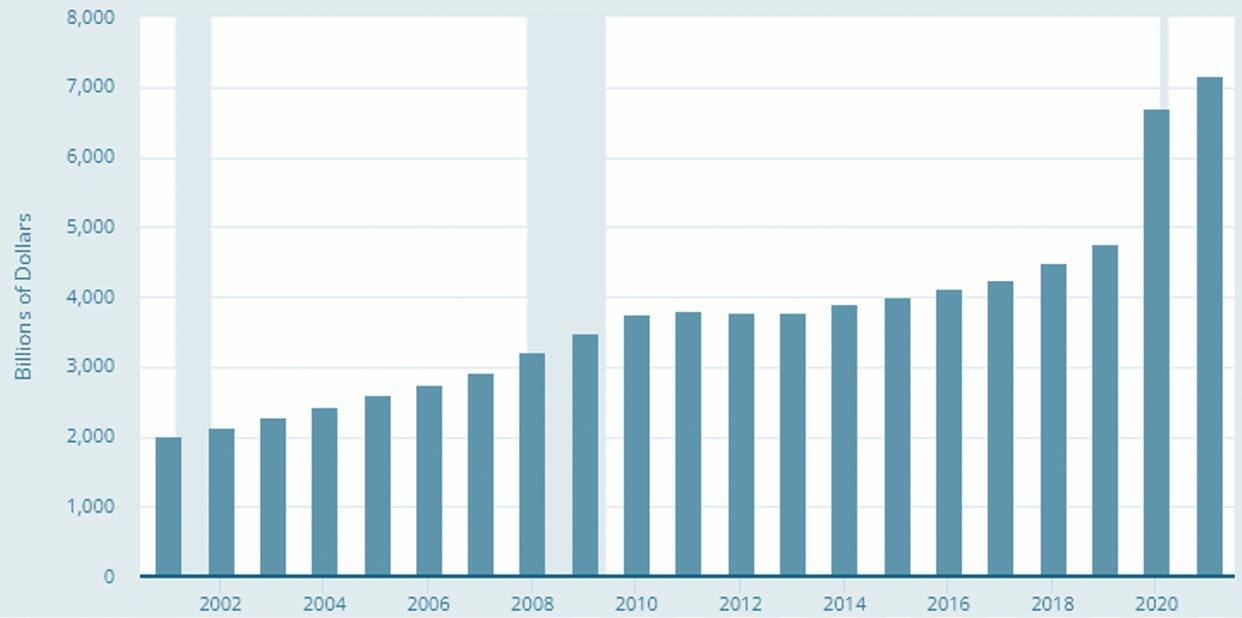
In recent years fiscal and monetary policies have been strongly linked. The fiscal condition of the U.S. was deteriorating before the pandemic of 2020 and 2021. Then Covid struck and blew a large hole in the federal budget. Federal expenditures totaled almost $14 trillion for the two-year period. By comparison, expenditures in the two years prior to the pandemic totaled “only” $9 trillion. (See Figure 12.)
Figure 12: Annual Federal Government Expenditures (2000 to 2021).
Note: Shade areas indicate recessions.
Source: Federal Reserve of St. Louis. Federal Reserve Economic Database (FRED), extracted from the database on December 15, 2022.
Federal budget deficits in 2020 and 2021 were 15% and 17% respectively of U.S. real GDP, compared to earlier years of about 4% of real GDP. These combined deficits created an incremental $5.3 trillion of federal debt, which represents about a 25% increase in total federal debt.
In 2020 the U.S. debt held by the public was 100% of America’s real GDP. That percentage was already at an unsustainable level, at least in the opinion of many fiscal economists.
Even accepting the “pollyannish” projections of the White House, the future appears fiscally dire. From 2020 to 2031, real GDP will increase from $21 trillion to $33 trillion. (See Figure 13). This 50% increase in real GDP seems reasonable if one can assume that there will be 10+ years of no recessions and/or wars. That assumption is unlikely if history is any guide and especially given the current febrile state of the economy in late 2022.
Figure 13: White House Budget Projections 2022 to 2031. (Including historic data for 2020 and 2021).
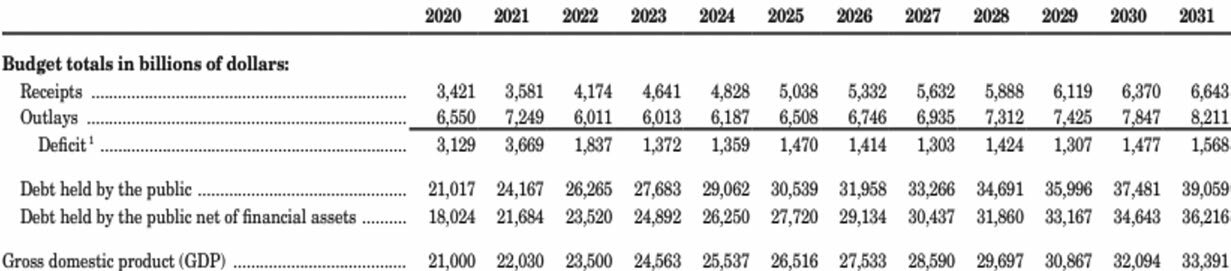
Source: The White House: Office of Management and Budget. The Budget of the U.S. Government Fiscal Year 2022. Page 37.
During that same period, and without recessions and/or wars, the total U.S. debt will increase from $21 trillion in 2020 to $39 trillion in 2031. The total debt of the government will increase at an annual rate of almost 6% while the economy will grow at less than half that rate, increasing the government debt to real GDP ratio from about 100% to 117%. The fiscal condition of the U.S. is going from bad to worse.
This high level of government debt translates into a significant interest payment burden. As recently as 2020, the United States had the highest level of government interest expense to real GDP of any relatively developed country according to the Organization for Economic Co-operation and Development (OECD). (See Figure 14.) The condition is even worse than that of Italy and Greece, two countries notorious for fiscal irresponsibility. More importantly, these statistics were calculated prior to the explosive growth in governmental debt during the Covid crisis when $5 trillion was added to the Federal debt load and little domestic growth occurred. The White House optimistically projects that by 2031 its debt load will increase by an additional $13 trillion.
Figure 14: Government Interest Expense as a Percent of GDP, 2020.
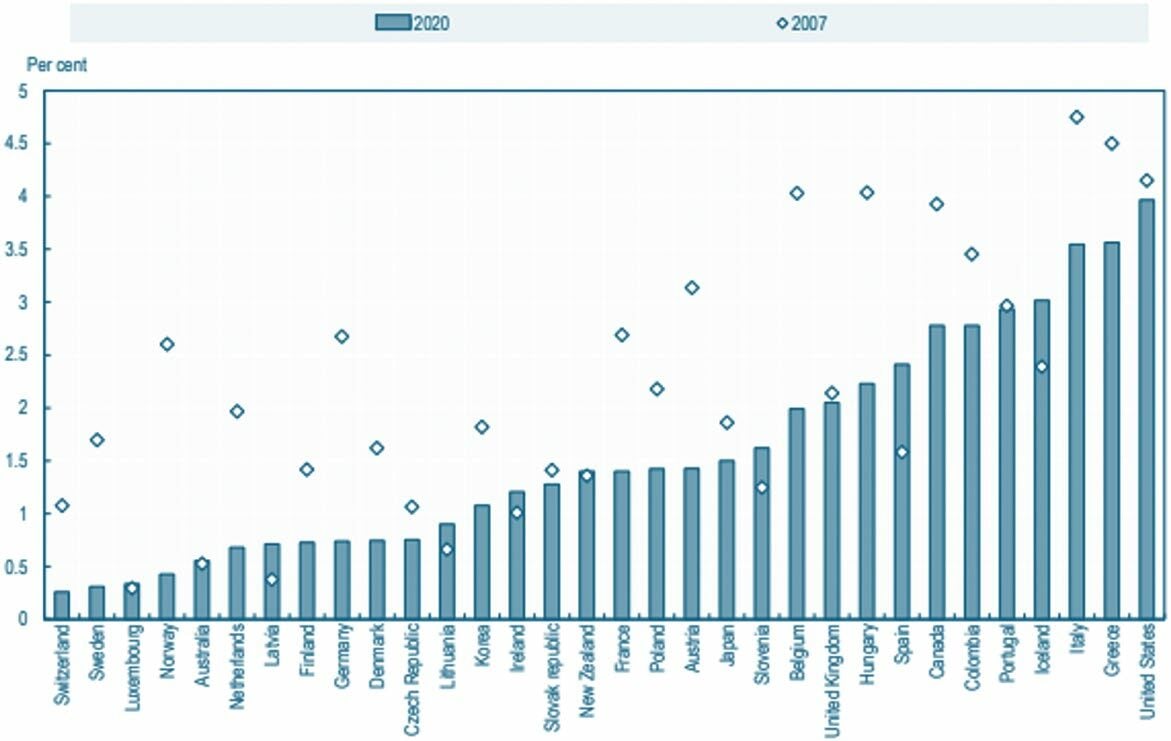
Source: OECD. OECD Sovereign Borrowing for OECD Countries 2021.
The U.S. government has been fortunate that the Federal Reserve has been an enabler of this profligate behavior. From the start of the financial crisis in
2008 through the Covid pandemic, the Federal Reserve has purchased massive amounts of Federal government debt. In 2008 the Federal Reserve held Federal government debt of about $500 billion. By 2021 the Fed ownership mushroomed to $5.8 trillion. The Fed was the buyer, not of the last resort but the first. The Fed’s ownership now totals almost 30% of the outstanding Federal debt.
In the process of purchasing this debt, the Fed facilitated interest rates at an unnaturally low rate thereby making the interest payments on the Federal debt almost manageable from a budgetary standpoint. (See Figure 15.)
Figure 15: Interest Rate on 10-Year U.S. Treasury Bonds, 2008 to Present.
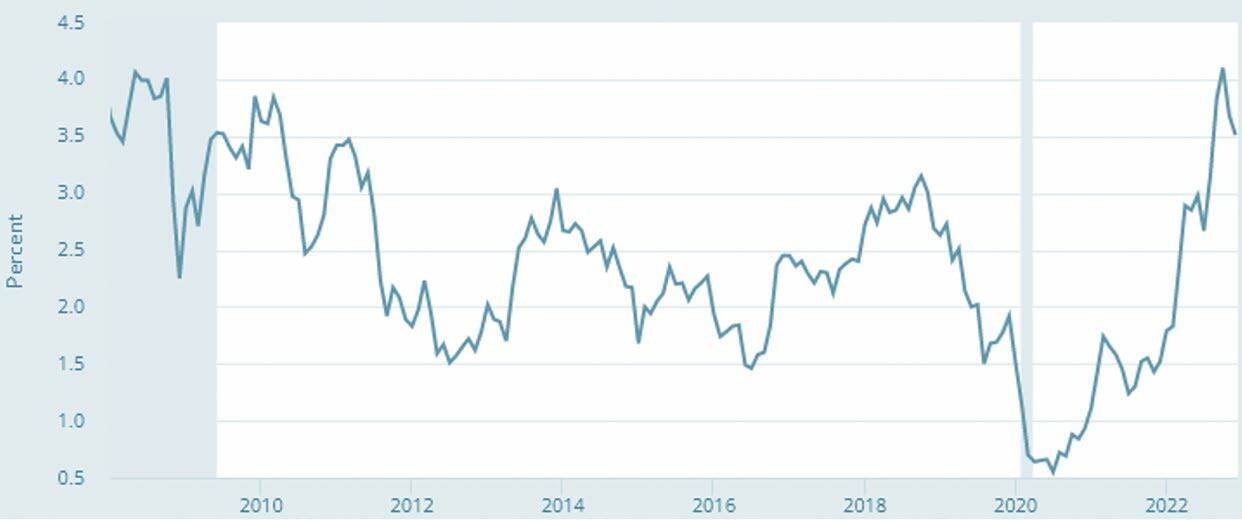
Source: Federal Reserve of St. Louis. Federal Reserve Economic Database (FRED), extracted from the database on December 15, 2022.
Finally in April 2022, the Federal Reserve decided the inflation was more than transitory, and it initiated a policy of higher interest rates. Prior to this epiphany, the low interest rates relative to inflation and historic interest-rate norms created favorable conditions for this massive incremental debt accumulation. In other words, the federal government could afford to borrow because rates were so attractive: not unlike households purchasing new homes when mortgage rates were attractive in recent years.
The U.S. Treasury could have mitigated the ill-effects of the massive borrowing by issuing long-term debt when interest rates were at or a multi-decade low. To put this situation in perspective, imagine you were buying a house in 2021 when mortgage rates were about 3%. Would you opt for a 30-year mortgage at the low rate or for an adjustable rate of 2.5% which could reset after a short period? Almost any borrower would opt for the 30-year mortgage thereby locking in the rate for the long term. Not our U.S. Treasury. (See Figure 16.) The United States borrowed short term because short-term interest rates were close to zero. This strategy lowered the cost of governmental borrowing because short-term interest rates were much lower than longer-term rates.
Figure 16: Average Maturity of Government Debt.
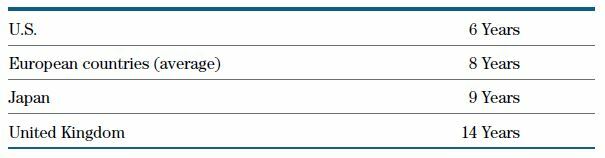
Sources: Various central bank databases and articles.
Such a maneuver helped to minimize the interest payments on the country’s massive debt load. Now that those rates are much higher and will need to be rolled over as the debt matures. The Treasury strategy will be fraught with negative consequences for funding our federal debt, especially in the long run. Other countries in general eschewed this short-sighted strategy. (See Figure 16.)
Best Guess About Fiscal and Monetary Policies
The Federal Reserve by its large increases in short-term interest rates in recent months will achieve its goal of bringing inflation down toward its goal of 2% within the upcoming 3-year period. In the process the economy will slow possibly enough to cause a recession. And in recent days, Fed Chairman Powell and the FOMC have surprised financial markets with its especially tough talk on subduing inflation.
Strong actions by the Fed will not mitigate the negative consequences for governmental finances in the long run. Corrective action can only come from the U.S. Congress.
Final Thoughts
If a mild recession occurs, and that is likely, the American economy is relatively well-positioned to endure the pain for several reasons:
- Labor markets are unusually healthy with job openings far exceeding the supply of available workers.
- Household balance sheets remain strong helped by government largesse to most households during and after the pandemic.
- The export of oil and gas to replace Russian energy supplies will contribute to U. S. economic growth and probably will continue if the war in Ukraine continues.
- State and local governmental budgets remain in relatively good shape given the large transfer of federal Covid support to these governments. In other words, significant tax increases in state and local taxes during this downturn will be less likely than during a “normal” recession.
The short-run problems of this slowdown or recession should be manageable without severe consequences for the financial condition of state and local governments and most households.
But the long-run consequences of high Federal spending and large budget deficits look ominous. The American economy will almost certainly grow at a modest rate of under 2% for the remainder of the decade. Yet Federal debt and the attendant interest payments will mushroom. These interest payments will soon choke critical domestic spending needs: defense, education, pensions, and health care to name a few. This problem may not be apparent in the next 2 or 3 years, but by 2030 very difficult tax and spending choices will be inevitable.
The Federal government is not headed into bankruptcy. Financial markets want and need America’s highly liquid and safe debt instruments. But the cost of this debt will be painful for the U.S. government and its taxpayers.
Fed Chairman Jerome Powell has been like an absent-minded football coach who looks at the scoreboard for the first time late in the fourth quarter to discover that his team is trailing 14-7. He instructs his team to start throwing “Hail Mary’s.”
So far, the strategy has not succeeded, but there’s still time on the clock. Perhaps one of those passes will find its mark, but in the meantime, there will be much hand wringing on the sidelines and in the stands.
HAPPY NEW YEAR!
About the Expert

Thomas Goho, Ph.D.
Former Chief Economic ConsultantThomas Goho, Ph.D. is formerly the Chief Economic Consultant for Stephens Inc. He also served as the Co-Director of Stephens University at Wake Forest University.
- Thomas Goho, Ph.D. is formerly the Chief Economic Consultant for Stephens Inc. He also served as the Co-Director of Stephens University at Wake Forest University. Tom enjoys a successful career in both education and business. He served as a professor of finance, Wayne Calloway School of Business and Accountancy, Wake Forest University for 30 years. Before retiring in 2007, Tom was the first to hold the Thomas S. Goho Chair of Finance. Tom also served on the Board of Directors of the Wells Fargo Family of Mutual Funds for 20 years, and also was on the Board of Directors of Lifepath Funds of Barclay’s Bank. A former Certified Financial Planner, Tom earned his BS and MBA from Pennsylvania State University and his Ph.D. from the University of North Carolina-Chapel Hill.