Looking back on 2022, the S&P 500 Index hit an all-time high on January 4 at 4,818.62(1). The Russian invasion of Ukraine began in February, and the Federal Reserve kicked off the first of its seven rate increases in March. Energy prices skyrocketed due to supply disruptions and production constraints, inflation hit a 40-year high in June at +9.1%(2) year-over-year (y/y), and then we had the mid-term elections in November.
The S&P 500 Index finished at 3,839.50(1), down 19.44% for the year. We saw a valuation reset, given higher interest rates, which resulted in lower valuation multiples. This reset was one of the main drivers behind the decline in the S&P 500 Index as the Price to Earnings multiple (P/E) went from 21.4x(1) at the beginning of the year to 17.6x(1) by year’s end. Meanwhile, earnings estimates for the S&P 500 Index started the year at $222.01(1) and were revised lower throughout the year to $218.46(1) by December 30 resulting in a 1.6% reduction.
2022 saw a continued rotation between value and growth as the higher valuation growth names came under pressure as interest rates rose. By the end of the year, Large Cap Growth was -29.89%(3) relative to Large Cap Value, which was - 9.69%(3), a difference of 20.2%.
Due to global supply chain issues, inflation was initially thought to be transitory but proved to be extremely persistent. Higher energy and housing costs added fuel to the already smoldering inflation fire. However, the two most recent Consumer Price Index (CPI) releases have pointed to a downward trend as we head into 2023. The prevailing thought is that some of the higher CPI prints last year are in our rearview mirror and that year-over-year inflation should continue to moderate.
As interest rates rose throughout the year, one area that became more attractive was Fixed Income. The effective yield of the ICE BofA Single A Corporate Index is now approaching 5.25%(4), which hasn’t occurred in more than 10 years. While the traditional 60/40 portfolio was impacted by higher rates in 2022, the stage is set for a more favorable Fixed Income market assuming rates don’t see a significant rise.
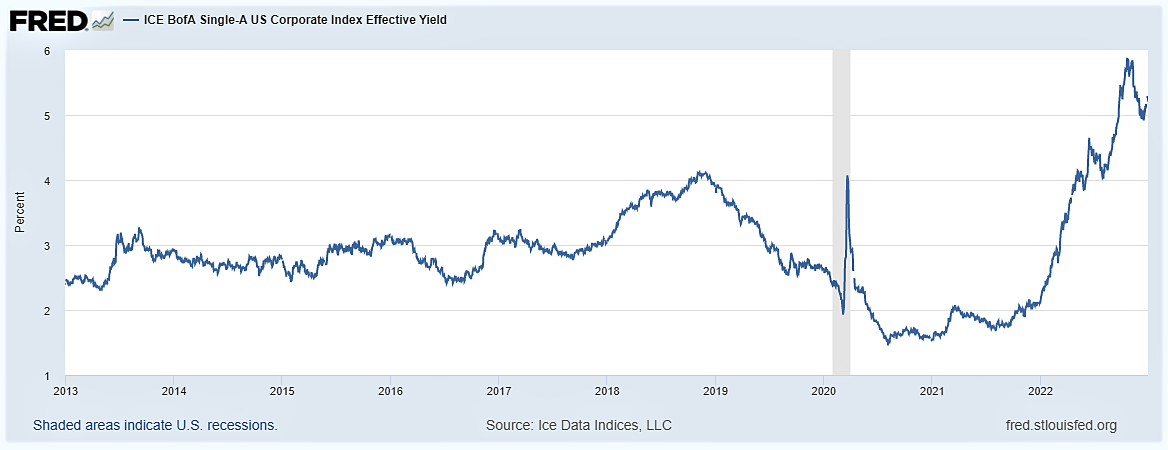
Source: St. Louis Fed
For 2023, there are two key things to keep in mind: 1) The consumer, and 2) The Federal Reserve. Given that personal consumption accounts for roughly 70%(2) of the Gross Domestic Product, the old saying, “as the consumer goes, so goes the economy,” could well be in full effect. With the most recent Federal Reserve
Summary of Economic Projections (SEP), it appears that we are closer to the end of the rate hiking cycle than the beginning. The most recent SEP indicates a terminal rate of 5.1%(5) vs. the current range of 4.25-4.5%(5) or roughly 75 bps of further rate increases. Will this be enough? Only time will tell.
Please reach out to your Financial Consultant with any questions you might have regarding your investments, and we wish you and your family a Happy New Year.
(1) Factset
(2) Bureau of Labor Statistics bls.gov
(3) iShares Russell 1000 Growth and Value ETF’s used as proxies
(4) FRED
(5) Federal Reserve.gov
Disclosures
- The foregoing has been prepared solely for informative purposes and is not a solicitation, or an offer, to buy or sell any security. Statements contained herein, while not guaranteed, are taken from sources we consider to be reliable. Past performance is no guarantee of future results. Securities products and services are offered through Stephens Inc., member NYSE and SIPC. For more information, visit www.stephens.com. © 2023 Stephens Inc. The information in the accompanying report has been prepared solely for informative purposes and is not a solicitation, or an offer, to buy, sell or hold any security or a recommendation of the services supplied by any money management organization. It does not purport to be a complete description of the securities, markets or developments referred to in the report. We believe the sources to be reliable, however, the accuracy and completeness of the information is not guaranteed. We, or our officers and directors, may from time to time have a long or short position in the securities mentioned and may sell or buy such securities. Data displayed on this site or printed in such reports may be provided by third party providers. This report is not an official account statement of your account, and you should refer to your official customer account statement in the event of a discrepancy in value. If you invest in mutual funds or other investment companies, such as exchange traded funds, you should carefully consider the investment objectives, charges, risks, fees and expenses of any investment company before investing. The prospectus and, if available, the summary prospectus contains this and other information about the investment company. You can obtain a current prospectus and, if available, a summary prospectus from your Financial Consultant. Please read the prospectus and, if available, a summary prospectus carefully before investing in a mutual fund or exchange traded fund, as it contains information about previously referenced factors and other important information. Performance data quoted represents past performance. Past performance does not guarantee future results. The investment return and principal value of an investment will fluctuate so that an investor’s shares, when redeemed, may be worth more or less than their original cost. Current performance may be lower or higher than the performance data quoted. You may obtain the most current month‐end performance data from your Financial Consultant by calling 800‐643‐9691. Investing in money market funds involves some element of risk, and you could lose money by investing in a money market fund. Although money market funds seek to preserve the value of your investment at $1.00 per share, this cannot be guaranteed. Investments in money market funds are not insured or guaranteed by the Federal Deposit Insurance Corporation or any other government agency. Money market fund sponsors have no legal obligation to provide financial support to money market funds, and you should not expect that the sponsor will provide financial support to money market funds at any time. Clients whose accounts are custodied at Stephens’ clearing broker, Pershing, are eligible to participate in the Stephens Insured Bank Sweep Program (“Bank Sweep Program”) (except for ERISA and IRA accounts). Assets in this program are insured up to the applicable FDIC insurance limit. It is your obligation to monitor your funds deposited at Program Banks in the Bank Sweep Program to ensure you do not exceed the applicable FDIC insurance limit. The Bank Sweep Program should not be viewed as a long‐term investment option. Any prices reflected herein are indicative and are subject to change without notice. Prices, yields and availability will change with market movement. The yield may differ if bonds are sold before maturity. Bonds might be subject to other calls that may exist. Product credit ratings may change without notice. Unpriced securities are not included in the current value of the portfolio. Assets which are not held at Stephens are not part of Stephens’ books and records. Annuities are held outside your Stephens account by the issuing insurance companies and are not covered by SIPC. Annuity information is provided by the insurance companies, and Stephens cannot guarantee its accuracy. Please refer to statements sent by the insurance companies for annuity valuations, tax reporting information and other details. Alternative Investments and other assets which are externally held are included on the report solely as a service to the customer and are not covered by SIPC. All Information about externally held Alternative Investments (including valuation) is derived from the customer or other external source, and Stephens cannot verify the accuracy of this information and is not responsible therefor. The indexes and models referenced in the charts presented are unmanaged and do not reflect any transaction costs or management fees. They were chosen to give you a basis of comparison for market segment performance. Actual investment alternatives may invest in some instruments not eligible for inclusion in such an index or model and may be prohibited from investing in some instruments included in such an index or model. You cannot invest directly in an index. The investment return and principal value of an investment will fluctuate so that the value of an investment, when sold or redeemed, may be more or less than the original cost. Blended benchmarks are rebalanced periodically. The blended return calculations for the benchmarks are determined by using the return performance data for the stated time period on each of the comparative index benchmarks as stated per asset class below, as reported by independent data services, and blending asset class and time period. Index performance information is provided for comparison only. Indexes are unmanaged, may assume reinvestment of all distributions and does not account for fees or any charges. It is not possible to invest directly into an index. Your portfolio value will fluctuate such that you may receive more or less than your original investment should you choose to close your account. Your net investment return will be reduced by advisory fees and other account expenses. All information on S&P Dow Jones Indices, LLC is Copyright © 2023 S&P Dow Jones Indices LLC, a division of S&P Global. All rights reserved. S&P Ratings Copyright © 2023 S&P Global Market Intelligence (and its affiliates as applicable). All rights reserved. See also www.stephens.com/terms‐and‐conditions For fee‐based accounts, performance data may or may not be shown after considering Stephens’ investment advisory fees (net performance). Advisory fees and other expenses and charges reduce the returns realized by the client account. Advisory clients are referred to Part 2A Appendix 1 (“Brochure”) of Stephens Form ADV for additional information regarding advisory fees. The net effect of the deduction of fees on annualized performance, including the compounded effect over time, varies with the size of the fee and the account’s investment performance. For example, an account with a 1.50% annual management fee and 7% annual performance before fees will have a net performance after fees of about 5.4% per year over a five‐year period. The same account with 12% annual performance will have a net performance after fees of about 10.32% per year over a five‐year period. Compounding will similarly affect the account’s performance on a cumulative basis. If this account pays another account’s advisory fee, the net performance shown on this report will be affected by the advisory fee paid on behalf of the other account. If the advisory fee for this account is paid by another account, the effect of the advisory fee will be reflected in the net performance of the account paying the fee. This document is intended only for the addressee and may not be reproduced or redistributed. If the reader is not the intended recipient, you are notified that any disclosure, distribution or copying is prohibited. Cost basis information may be incomplete or may not accurately reflect the methodology used by a particular client. Neither Stephens Inc. nor its representatives provide legal, accounting or tax advice. Due to the fact that each individual’s tax status may vary, please consult your tax advisor before making your investment decisions. Pie Chart slices labeled as “Other” may include securities classified as other by the provider of asset classification data, as well as securities that did not fit in the other slices displayed. Stephens ADV Part 2 and privacy notices are available now at www. stephens.com/private‐wealth-management/ form‐advs‐and‐privacy‐notices. To access your FC’s SEC Advisor Biography, go to www.stephens.com, use the search bar in the top right corner of the home page and search by your FC’s name. SEC Advisor Biographies are also available in the “Our Team” section and are there for your review. Securities and/or Advisory Services offered through Stephens Inc. Insurance products offered through Stephens Insurance, LLC. Additional information is available upon request. Please contact your Financial Consultant with any questions